Every franchise is looking for that player who seems to come out of nowhere to be a major contributor in their lineup. Players like Jose Bautista who went from 1.8 WAR in 2009 to 6.5 WAR in 2010 or Justin Turner who went from 0.5 WAR in 2013 to 3.4 WAR in 2014. The cost for acquiring these players was affordable because they were no longer prospects and most of the league had written them off as potential everyday players.
If a team had the ability to identify which players are most likely to exceed industry expectations, they would have a significant advantage over their competition. That is why I decided to create a model to identify potential breakout performers.
Methodology
The first thing I needed to do was to define what constitutes a breakout performance. I thought of several different definitions, but I decided to define a breakout performance as any player that exceeded their career high WAR in a single season by at least 2.0 WAR. So, if a player had recorded a season of 0.0 WAR, they would need to have at least a 2.0 WAR season. If a player had recorded a season of 1.0 WAR, they would need to have at least a 3.0 WAR season and so on and so forth.
I chose 2.0 WAR, because it seemed like a reasonable balance of making it a difficult threshold for a player to reach, but also not limiting the number of positive cases. If there are not enough positive cases in a model, it can hurt the model’s performance. I also thought that 2.0 WAR is what the average MLB player produces in a full season, so using that as a cutoff would be akin to a team gaining a league average player for no cost.
Using a binary variable instead of a continuous variable to define a breakout performance means that I can use a logistic regression model to predict which players are the most likely to outperform their previous seasons. Now that I have determined which model to use, the next step is to determine what the data set will be.
Collecting the Data
To create a data set, I started with players that started their domestic professional baseball career in 2006 or later. I chose 2006 as a cutoff, because it is the furthest back that Minor League data is available on FanGraphs, and I only wanted to include players with their full minor league history.
I also decided to only include 2006 to 2019 MLB data. The shortened 2020 season would be difficult to include in a project of this nature, so I decided to only include full seasons in the data set, and this would still allow me to use 2021 data to check the validity of the model.
Next, I limited the data set to include only players with three hundred or more career Major League plate appearances. I chose three hundred, because it is a reasonable number of plate appearances for evaluators to form an opinion on a player, while still allowing for further growth and development at the Major League level.
Allowing players with fewer than three hundred plate appearances would allow for more prospects in the analysis. However, the objective of this project is to find players that are most likely to outperform their previously observed production. Prospects do not have enough of a Major League record to compare to, so it would be unwise to include them in the model.
Building the Model
After these restrictions, the data set consisted of 1684 players. The next thing I needed to do was determine which variables to use in the model. I considered a variety of Major League and Minor League statistics, the prospect’s highest Baseball America prospect ranking and personal details like height, weight, age, position, and birth country. After several model implementations, the final model consisted of eight variables: season age, BMI, previous season WAR, season high WAR, MLB ISO, MLB speed score, MiLB walk rate, and MiLB batting average. Below are the coefficients for each variable in the model.
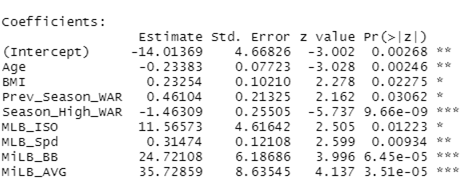
Most of the variables have a positive value except for season high WAR and age. This means that the older a player is and the higher their season high WAR is, the lower their chances are of having a breakout performance. This may seem counterintuitive for season high WAR. However, it makes sense that a player like Bryce Harper or Mike Trout would have more difficulty producing a 12-win season than someone like Justin Turner needing to only produce a 2.5-win season in 2014. The higher your breakout threshold is, the more things like injuries can derail your chances of posting an extremely high WAR total.
The other thing that caught my attention is that BMI has a positive coefficient value instead of a negative one. Sometimes, a high BMI can be an indicator of poor health, but BMI is an extremely crude measurement. It does not consider things like muscle mass or waist size and many professional athletes are obese by this BMI measurement when they just have far more muscle mass than the general population. My theory is that many players in the model with a high BMI are extremely fit individuals with high muscle mass and this is what is causing a positive coefficient value. If I had access to more precise body measurements, I would certainly include it in the modeling process.
Testing the Model
With the model completed and the 2021 season officially in the books, I can now examine the accuracy of the model for this past season. There were 303 position players with over three hundred career plate appearances in the data set and below is a confusion matrix showing how many of the model’s predictions were correct.

The model’s overall accuracy was 83.83% with 254 of the 303 total predictions being correct. With 244 of the 250 predicted non-breakouts being correct and ten of the fifty-three predicted breakouts being correct. These results are consistent with the testing set I used to calibrate the model, so I am satisfied that the model is performing as expected.
The model is clearly better at distinguishing which players are not going to breakout versus finding players that will breakout. Since many breakout performances seem to come out of nowhere, it makes sense that breakouts would be more difficult to identify. This means that the model is better at eliminating a large amount of breakout candidates and finding potential breakout candidates, rather than accurately predicting breakout candidates.
For anyone who is curious, below is a list of the sixteen players that had a breakout season in 2021 with their 2021 WAR, their previous season high WAR and their predicted chance of a breakout performance.

There are some hits in here with Vladimir Guerrero Jr., Austin Riley, Kyle Tucker, and others easily reaching the 2-win improvement threshold, but there are also some misses like Shohei Ohtani, Bryan Reynolds and Trea Turner.
I think Ohtani is the most egregious miss, but I would like to point out that he had no minor league data and a poor 2020 showing that severely brought down his breakout prediction. So, the result looks bad, but I understand why the model missed on his 2021 breakout.
2022 Breakout Candidates
Since the model seems to be serviceable. The next step is to look for potential breakout performances in 2022. Below is a list of the sixty-one players that the model predicts will breakout along with the player’s most recent team, their 2022 season age, 2021 WAR, the WAR threshold for a breakout season, and the percent chance the model predicts for the player having a breakout season.
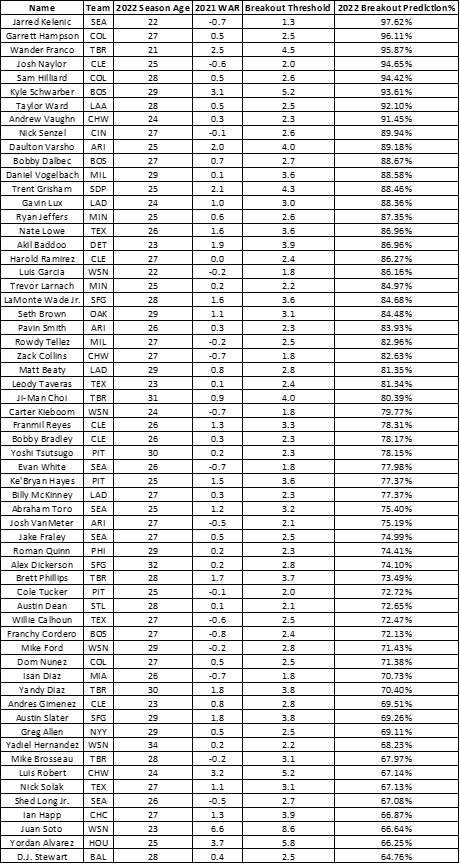
Before anyone starts buying Garrett Hampson and Sam Hilliard stock, please remember that the model is far more accurate at predicting which players will not breakout, so there are many players on this list that will not reach their breakout threshold. However, the chances of finding a breakout season from a player not on this list is going to be much lower.
It is my hope that this model will continue to identify future MLB contributors and I look forward to revisiting the subject when more data from Statcast is available. I believe that player measurements like exit velocity and launch angle could drastically improve model performance and I plan to incorporate them into the model in the future.

Nice work Adam, enjoy reading your posts. This is very practical and easily followable.
Out of curiosity, where are you getting player BMI data from?
LikeLike
I got the height and weight from Baseball Reference and calculated the BMI on my own. Obviously the weight has huge error bars.
LikeLike
Ah, that makes a lot of sense. Smart idea. Thanks!
LikeLike